
Method
Using the Japan Meteorological Agency’s data download service, I’ve downloaded the last 75 years of snow accumulation data for a few select locations around Hokkaido: Kutchan (home to Niseko ski resort), Furano City, and Sapporo City. The figures are interactive – you can exclude months and years, to see how things change.
KEY POINTS
We can’t speak to the future (and what climate change might mean for Hokkaido’s winters), but as far as past trends tell us, this year is a low start, for sure. It’s not the lowest on record though (except for Sapporo). But according to Japan Meteorological Agency (JMA) data, there’s no worsening trend for snow accumulation. So, as far as previous trends are concerned, we can only call it just one dot in the natural ebb and flow of snow here in Japan’s wild north…🤞
KUTCHAN SNOW REVIEW (JAN 2020)
- December
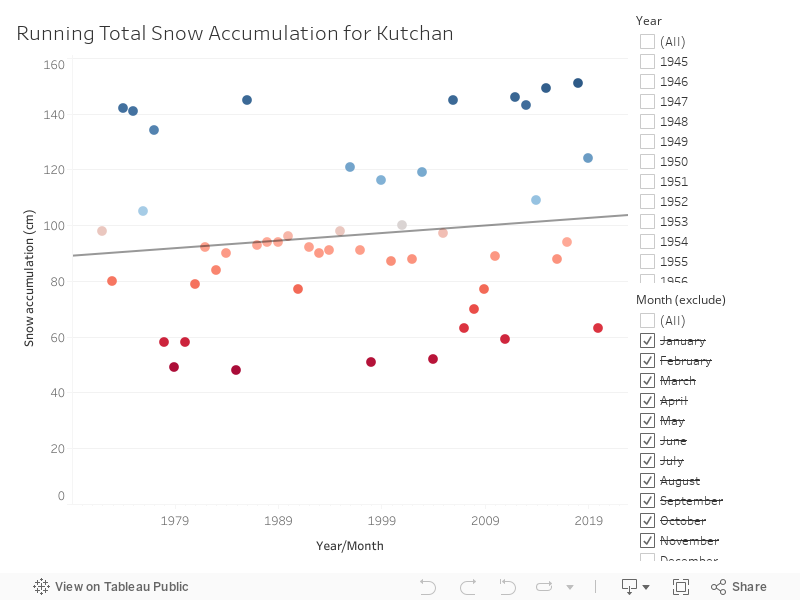
With only 63cm of accumulated snow in Kutchan in December 2019, the tide was low, but not the lowest it’s ever been. At the end of December 1984 there was only 48cm of snow accumulated in Kutchan. As for trends, if anything there’s a positive upward trend over the last 50 years in Kutchan (1970-2019). That is, there’s a trend towards more snow accumulating in December (but this isn’t a statistically meaningful trend). - January
I’m writing this on the 14th of January 2020. With more than half of the month still to go, Kutchan’s already got 79% of snow that had accumulated by the end of January 1973 (a dismal 94cm).
FURANO CITY SNOW REVIEW (JAN 2020)
- December
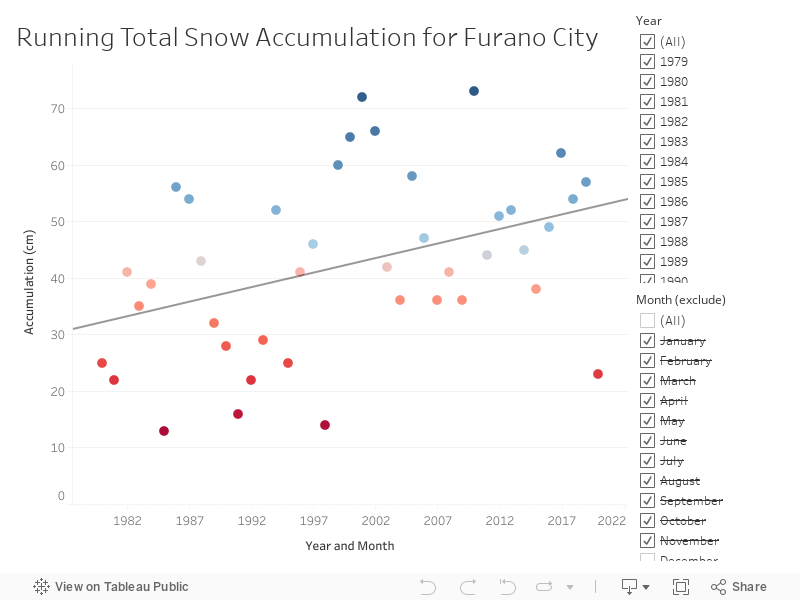
With only 23cm of accumulated snow in Furano in December 2019, the tide was low, but not the lowest it’s ever been. At the end of December 1984 there was only 13cm of snow accumulated in Furano. As for trends, if anything there’s a positive upward trend over the last 40 years in Furano (1979-2019). That is, there’s a trend towards more snow accumulating in December. - January
I’m writing this on the 14th of January 2020. With more than half of the month still to go, Furano has already got 75% of snow that had accumulated by the end of January 1991 (a dismal 36cm).
SAPPORO CITY SNOW REVIEW (JAN 2020)
- December
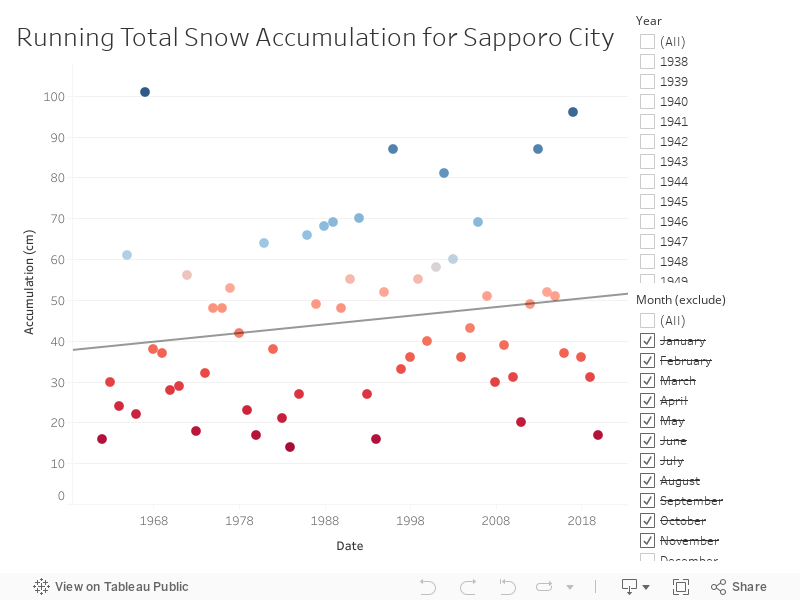
With only 17cm of accumulated snow in Sapporo in December 2019, the tide was about as low as it has ever been, but not the lowest. 1983 saw only 14cm accumulate by the end of December. As for trends, if anything there’s a positive upward trend over the last 60 years in Sapporo City (1961-2019). That is, there’s a trend towards more snow accumulating in December. - January
I’m writing this on the 14th of January 2020. With more than half of the month still to go, Sapporo has only got 9cm of snow accumulated. That’s only 28% of snow that had accumulated by the end of January 1997, which had the least snow accumulated since records began – a dismal 33cm.
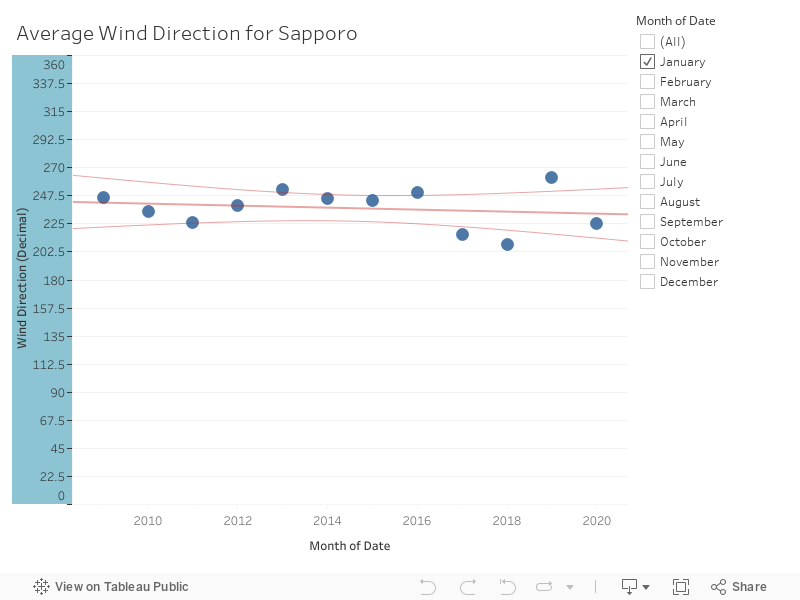
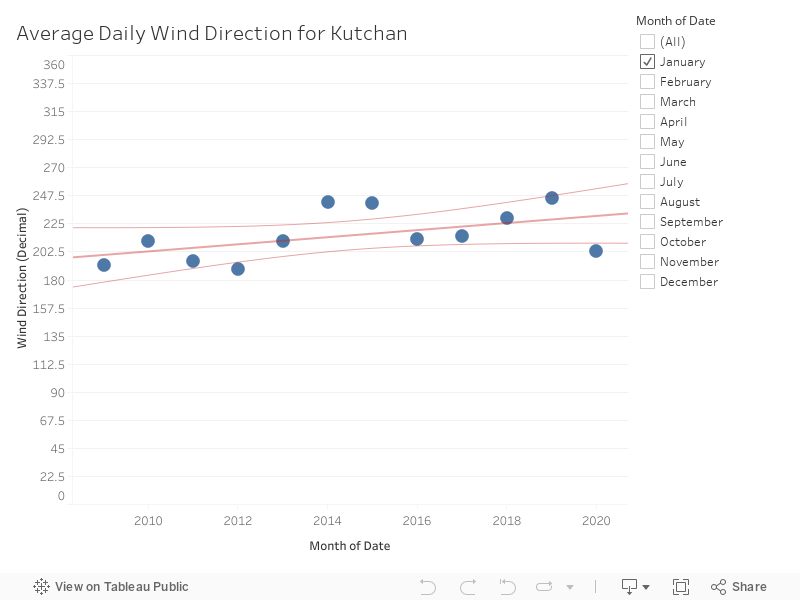
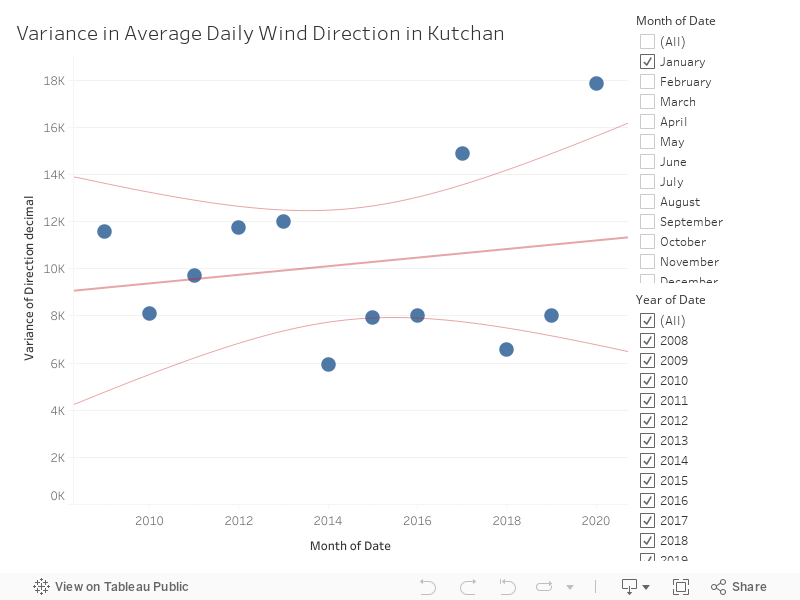
WIND DIRECTION
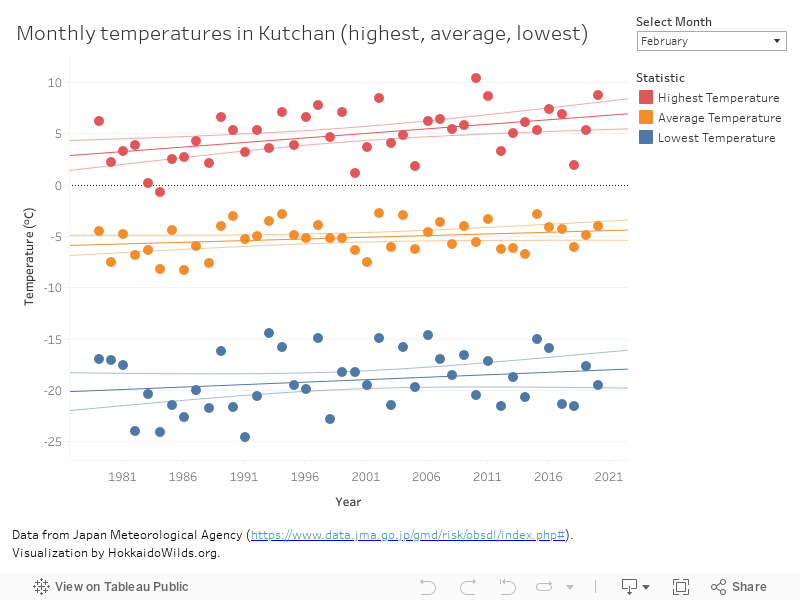
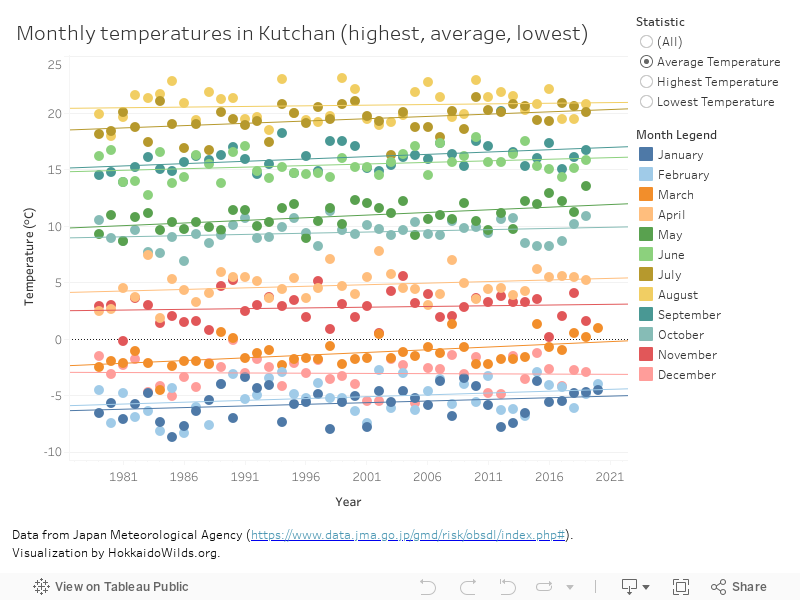
TEMPERATURES
For example, January lowest temperatures seem to be getting warmer. February highest temperatures seem to be getting higher – the 10-year average monthly high between 1979 and 1988 for February was 2.7°C, whereas the 10-year average monthly high between 2011 and 2020 for February was 5.9°C, an increase of 3.2°C. March temperatures also seem to be getting higher.


4 thoughts on “Hokkaido Snow Statistics – A Jan 2020 Selective Review”
Thanks for the quick post Rob!
Hi Rob, thanks for taking the time to get these charts and stats together! Is there similar data available for the average temperatures in the region over this time period? Also will you have an update on this at the end of the season? Thanks again!
Hey Stuart, thanks for the feedback. Some stats regarding temperatures would indeed be interesting. I’ll see what I can rustle up, as I was going to dig into temperature data for a different region soonish. Might be towards the end of March though!
Actually, curiosity got the better of me – I’ve added Kutchan’s historic temperature data (monthly highs, average, lows) to the bottom of the post. Overall a bit of an increase over the last 50 years or so it seems.