
NOTE: If you’re looking for this 2018/2019 season’s Japan snow predictions and general Hokkaido climate information (in an easily-digestible format), check out The Grasshopper’s musings on MountainWatch here (ht: Tanuki Lodge).
SUMMARY: Predicted changes in Hokkaido snow depth and volume
SHORT STORY: In 80 years time, central Hokkaido areas around the Daisetsu Range, including Asahi-dake, are predicted to have an increase in snowfall (around an extra 60-100cm), whereas almost everywhere else in Hokkaido will see a decrease (between 30cm and 60cm).
LONGER STORY: Below are predicted changes in Hokkaido snow depth and snowfall, translated from the Sapporo Branch of the Japan Meteorological Agency’s report on Hokkaido regional climate change, titled Hokkaido Climate Change (Second Edition) report (北海道の気候変化 第2版). This was published in March 2017, with a subtitle that reads “the past 120 years and predictions for the future” (これまでの120年とこれからの予測). Of interest for this post is section 2.3 of the report – Snow accumulation and snowfall outlook (積雪・降雪の見通し) (pp. 26-27). Here, I make a translation of that section (all errors in translation are my own – I’m not affiliated with the Japan Meteorological Agency).
Original Japanese overview webpage: https://www.jma-net.go.jp/sapporo/tenki/kikou/kikohenka/kikohenka.html
Translated from Hokkaido Climate Change, 2nd Edition (2017) by the Japan Meteorological Agency Sapporo Branch (北海道の気候変化第2版), pp. 26-27
2.3 Outlook for Snow Accumulation and Snowfall
2.3.1 Maximum Snow Accumulation
Maximum snow accumulation levels are predicted to decrease across Japan [comparing the end of the 20th Century to predicted levels at the end of the 21st Century], except for some regions of inland Hokkaido. In particular we predict large changes during February and March months on the Honshu Japan Sea coast (abbrev. Japan Meteorological Agency, 2013). While the maximum snow accumulation levels of some inland areas of Hokkaido are expected to increase, overall we predict a decrease, with no large differences in those decreases across regions (Fig. 2.3.1-1, Fig. 2.3.1-2). Generally speaking, atmospheric water vapor levels will increase along with increases in air temperature and sea surface temperature, both of which are triggered by global warming. Rainfall will also increase. During [global] warming, the frequency of snowfall will decrease due to increases in air temperature, and we will see a trend towards decreasing snowfall. At the same time, even during times of warming, in regions where temperatures are cold enough, an increase in precipitation can be expected, resulting in higher snowfall volume. By the end of the 21st Century, it is expected that some interior Hokkaido regions will see an increase in snowfall volume (see Section 2.3.2).


2.3.2 Snowfall volume
The Japan Meteorological Agency expects some areas of inland Hokkaido and Honshu to see an increase in snowfall volume, whereas in other areas they expect a decrease (abbrev. Japan Meteorological Agency, 2013). Except for some areas of inland Hokkaido, annual snowfall volume is expected to decrease (Fig. 2.3.2-1, Fig. 2.3.2-2). Whereas decreases are expected in the beginning (November) and end (March to April) of the annual snowfall season, the decrease during the peak of the season (January) is not clear (Fig. 2.3.2-3).


DATA: Hokkaido Snowfall Yearly Averages by Region (cm)
Here I’ve only included Sapporo, Kutchan (near Niseko) and Furano. If you’d like to see more centers added, please let me know. Use the filters to select/deselect particular months and/or regions.
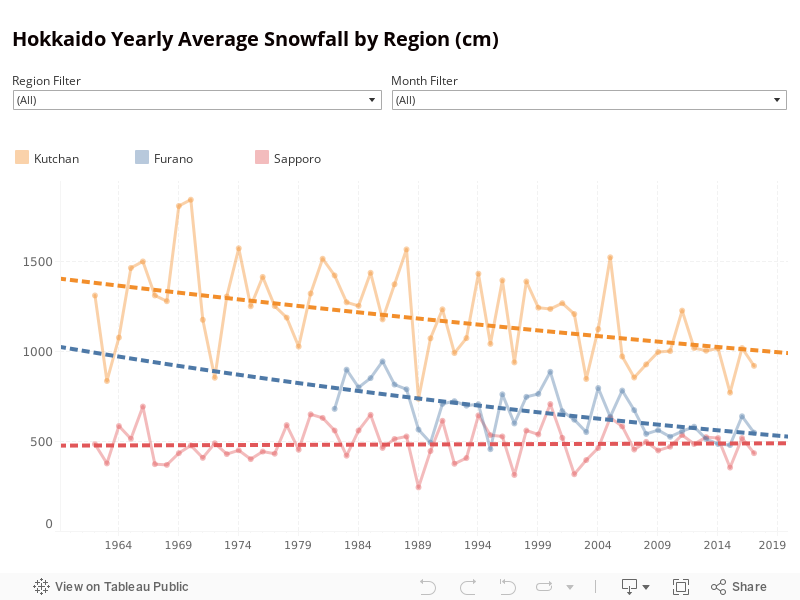
Source: Japan Meteorological Agency Raw Data (https://www.data.jma.go.jp/gmd/risk/obsdl/index.php)
DATA: First snow date for Sapporo City
There was quite a fuss in November 2018, when Sapporo City tied the record for latest first snowfall on record (November 20th 1890). Below are the dates of first recorded snow in Sapporo City for the last 140 years from 1877 till 2017. The short story is that there’s no trend – snowfall in Sapporo City doesn’t appear to be getting later each year. I produced the graph using raw values converted from a table received on paper from the Japan Meteorological Agency in Sapporo.
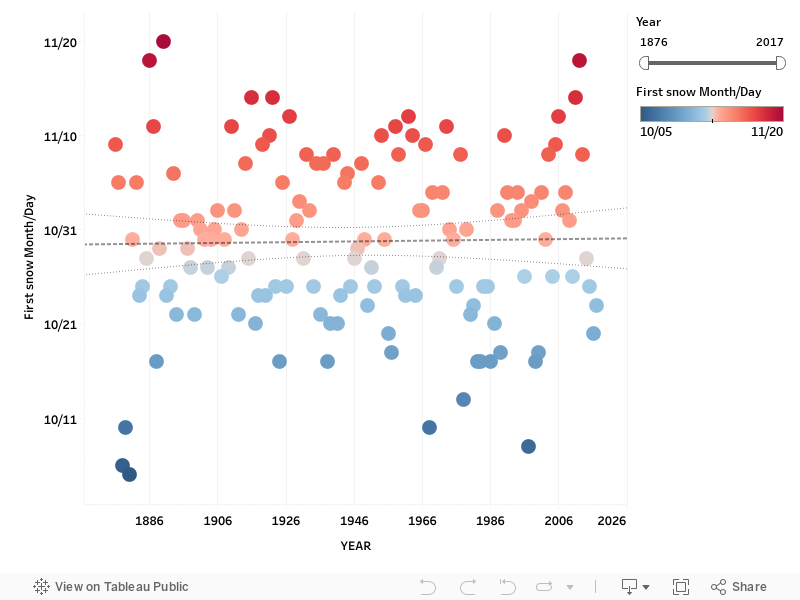
Source: Japan Meteorological Agency Raw Data kindly provided on paper by the Sapporo Office.
PDF scanned version | Raw (uncleaned) converted Excel sheet | Final cleaned Excel sheet
My excursion to the Japan Meteorological Agency in Sapporo
I naively thought that I’d be able to find the data on the Japan Meteorological Agency’s website. However, after spending a couple of hours searching, and then calling the agency office in Sapporo, I found out the only way was to go to the Japan Meterological Agency in Sapporo and get a print out. I got their permission to convert it to data. Here’s some pictures. Yes, of course they have a mascot. A happy Harerun (はれるん).


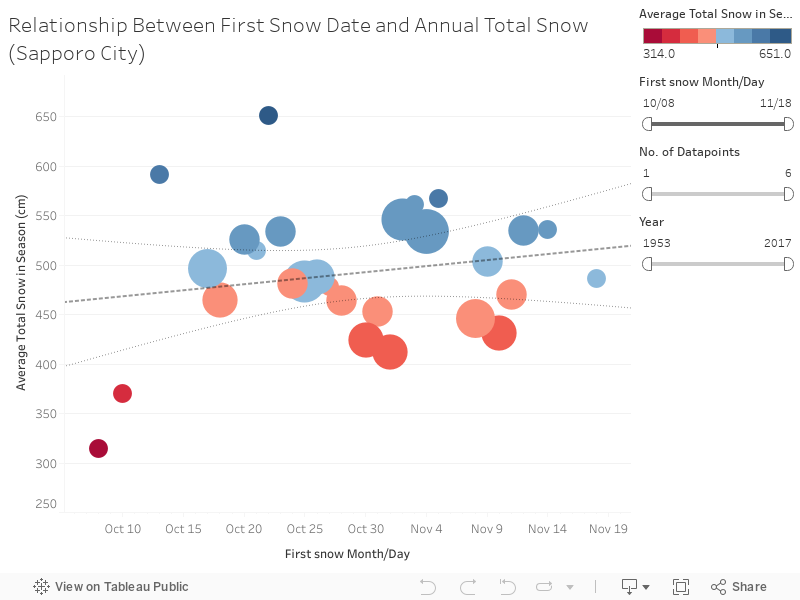
Q&A: Is there a relationship between first snow date and total snowfall for the season?
SHORT ANSWER: No.
LONGER ANSWER: You’d be forgiven to think that if the snow is late in any particular year, then we’d get less snow over the course of the season. However, this isn’t the case. The figure below shows the relationship between date of first snowfall and total snowfall for a given year. There’s no discernible relationship.
There’s an important caveat though: some ‘average’ snowfall datapoints are not very reliable, because they’re based on just one year’s snowfall data. That is, some first snowfall dates have only occurred once during the time period available (1952-2017). October the 8th, for instance – the first snowfall has only occurred once on that date. Other dates have seen multiple occurrences of first snow over the years – November the 4th is the ‘most popular’ date for the first snowfall, having experienced the first snowfall six times.
Therefore, use the ‘No. of Datapoints’ filter to filter out that data that only has one year’s worth of snowfall data.
Source: Japan Meteorological Agency Raw Data (https://www.data.jma.go.jp/gmd/risk/obsdl/index.php)


16 thoughts on “Hokkaido Snow Statistics”
thanks for your report. i am noticing an annual increase in temperature this will have an impact on snow bases and ultimately falls when the average is above 0. 🙁
Hi Rob,
Thanks for the great article and research. I am having some difficulty rectifying the first page and the second page (after following JMA climate change forecast link), you have tables on both and when looking at the Kutchan and Furano data the first has an upward trend and the second has a strong downward trend but as I read it they should be telling me the same story?? especially when just focusing in on Jan and Feb months which I am interested more in. Do you see the same issue? Sorry if I have made a simple mistake
I see what you mean. First, some definitions. The snowfall statistics on this page are just that – the snowfall each hour summed to a total for each 24hr period, and then each 24hr period summed to a total snowfall data point for the month. The snow accumulation statistics on the other post are the deepest recorded snowpack depth for a particular month. In theory, if total snowfall is decreasing, so too should snowpack depth? So I’m not sure what is going on there.
I checked and double-checked the data, and it is what it is. For example, the deepest recorded snowpack depth in Kutchan in the month of February 1980 was 168cm, despite a whopping total of 438cm of snow falling that year in February. In fact, looking at the 3-month totals for 1980, the data is telling me that 1014cm of snow fell between Dec 1st 1979 and Feb 29th 1980, and yet the deepest the snowpack was recorded at was 168cm for the same period.
I called the Sapporo Branch of the JMA to ask why this was the case, and they said that it may have been human error in recording the snowfall data. “In those days it was all done manually by a person. Nowadays it’s all automated,” they said.
If that’s the case, then the downward trend we see on the interactive figure on this page for Kutchan may not be entirely accurate…sigh.
I hope this helps!
Greetings and thanks for the information.
My family and I live in Thailand.
My 6 & 7 year old daughters are dreaming of snow.
I have arranged to fly us out from 26 Nov-2 Dec 2019.
In your estimation, can we expect to have some accumulation?
Is there any good sledding areas or places to observe?
The top of Asahidake Ropeway for sure will have snow.
Pingback: Why Japan? – Chelsea and Mike Bike
Superb effort Rob, interesting analysis . Am I correct in assuming that there is also no correlation between the date of hatsuyuki and snowfall amounts for the season?
Thanks Ian! I plotted that data, and sure enough, there’s no relationship: https://hokkaidowilds.org/hokkaido-snow-statistics#first-total-snowfall-correlation-sapporo
thank you for the info.
congrats again on the new website.
Thanks DC!
Thanks a lot for the great work Dana. Really interesting.
The name’s Rob 🙂 But thanks!
Great data and graphics.
Thanks Dana! It has been a while since I’ve played with Tableau – the last time I was creating interactive graphs for a paper I published: https://relationalmobility.org/
Great analysis and effort! I need to step it up with my plans of slashing pow in Japow. 😊
I’m impressed with the level of accuracy and consistency of data available as well as how far back it goes.
Thanks Dragos. Yes, the Japan Meteorological Agency is impressive with their data!